
The platform
A closer look at how Canopulse works.
The homepage is the short version. This page walks through the full workflow, the deliverables, the transparency, and who it is for.
Planning workflow
One workspace for source-grounded screening.
Canopulse is built around one job: move a team from public datasets to an inspectable tract package without hiding uncertainty or inventing certainty.
Canopulse operating view
UCRI tract evidence pipeline
01
Find the tract
Search by county, city/place, tract number, or GEOID and inspect the tract-level UCRI record.
02
Read the drivers
See which measured components are pushing the score and which are less dominant.
03
Create evidence
Open a print-ready screening report with confidence, sources, limitations, and next analysis.
04
Export the record
Move JSON, CSV, batch summaries, and source tables into planning and grant workflows.
Five weighted signals
0-100 percentile scale
Environmental burden uses CalEnviroScreen 5.0 Pollution Burden percentile.
The workflow supports screening and planning. Site-level feasibility, ownership, utilities, cost, regulatory review, and community input remain separate checks.
Inspect validationWhy this tract, not that tract?
Two California tracts. One transparent answer.
Compare current California UCRI records from different counties and see how the five statewide component percentiles flow into each released score.
Report-ready deliverables
Exports that look like planning work, not screenshots.
The reporting layer is designed to make UCRI inspectable: score, rank, confidence, component math, raw indicators, source lineage, and limitations stay together.
Executive screening summary
Dominant drivers and weighted points
On-the-ground conditions
State, county, and place comparison
Planning interpretation and limitations
Method and source appendix
Reports support screening and planning. They do not determine final site selection, project feasibility, funding approval, parcel ownership, cost, regulatory compliance, or community acceptance.
California UCRI tract report
Tract 4, Fresno County
1.0% canopy cover
CDC SVI percentile 100.0
118.5°F summer LST
Report and audit exports
Browser print-ready report
Batch audit rows and metadata
Review-ready batch workbook
Model, source, and report identifiers
Start with one tract or paste a whole study area.
Generate planning-support language, compare high-priority records, and keep invalid or provisional tracts visible instead of quietly dropping them.
California report output
Open the report output. This is the released workflow.
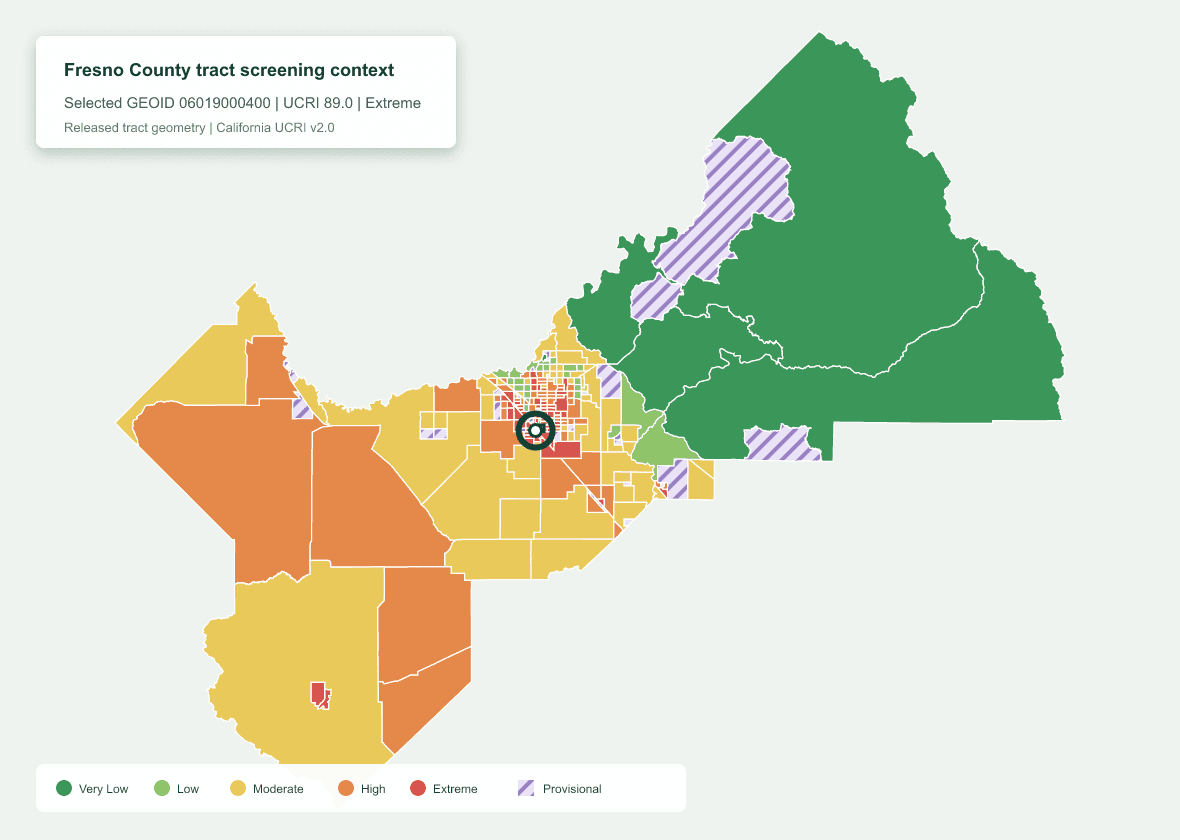
A current California UCRI example for Fresno Census Tract 4, GEOID 06019000400. Every displayed score, rank, component, raw condition, and release label is copied from the released tract record.
California UCRI | sample tract report
Tract 4, Fresno County
GEOID 06019000400 | Fresno, California
89.0
UCRI | Extreme
State rank
#118
County rank
#1
Place rank
#1
Confidence
Moderate
Largest weighted drivers
Current public release: July 2026
Environmental burden source release: July 1, 2026
Sample generated July 20, 2026
Canopy cover
1.0%
Summer LST
118.5°F
Impervious
75.4%
CDC SVI
100.0
CES burden
99.3
- California tract reportPrint-ready maps, ranks, drivers, raw values, provenance, limitations, and audit ID
- Area report viewsCounty and city/place summaries with explicitly labeled aggregation methods
- California CSV exportsReleased tract and selected-area records for analysis workflows
- Source registry CSVNamed products, vintages, units, licenses, documentation, and source access
- Model registry JSONVersion separation, formulas, scaling scopes, and release dates
- Methodology PDFFormula, source roles, release controls, and interpretation limits
- Audit recordModel version, generated time, geography identifier, and frozen release context
Report outputs organize released screening records. They do not establish parcel conditions, program eligibility, compliance, medical risk, official designation, or project outcomes.
Release status
What is available today, function by function.
Every advertised function carries one of four statuses. The list is recorded in code and checked before each deployment, so a planned function cannot be described as available anywhere on the site.
- Available and tested17
- Works today on the current release and is covered by an automated gate that runs before every deployment.
- Limited coverage6
- Works today inside a stated boundary. The boundary is written beside the function rather than discovered by using it.
- Demonstration4
- Runs with labelled sample rules or values, and every output says so. It is not a real program, proposal or measurement.
- Planned9
- Described so that nobody buys it by mistake. Not available, not for sale, and not implied anywhere else on the site.
Explorer
| Function | Status | What it does today | Limit to know |
|---|---|---|---|
| Statewide Explorer | Available and tested | County, city and place, and census tract views of the July 2026 California UCRI release across all 58 counties. | Screening context at census-tract scale. Categories are relative quintiles of this release, not hazard determinations. |
Reports and exports
| Function | Status | What it does today | Limit to know |
|---|---|---|---|
| Tract screening report package | Available and tested | Multi-page PDF, tract and neighborhood maps, XLSX workbook, CSV, GeoJSON, source records and a reproducibility manifest for any released tract. | Every file in a package carries the same release id. Output is evaluation material and is not a site, eligibility or compliance determination. |
| County and place reports | Available and tested | Screening summaries and PDF reports for every California county and released city or place. | Place assignment follows the published land-area overlap rule. A place report describes assigned tracts, not parcels. |
| Project-area analysis | Available and tested | Analyse a drawn or uploaded boundary as a set of released tracts and generate a project-area report. | A boundary selects whole tracts. Partial overlap never turns a tract statistic into a parcel measurement, and drawn areas are screening geographies rather than official boundaries. |
| Batch study-area reports | Available and tested | Comparative workbook, map package, batch CSV, XLSX and GeoJSON, a QA record and a structured summary for larger study areas. | Runs through the batch worker under published evaluation limits. Large jobs queue rather than run instantly. |
| Decision brief | Limited coverage | An editable Markdown brief with a PDF, tract data export, data dictionary, GeoJSON layer of the project's tracts, evidence record and hashed manifest, generated once per project version from the frozen release. | Screening context only. Declared scenarios appear only when recorded on the project version, and no cost, outcome or eligibility claim is made. |
| Editable application draft | Demonstration | An editable Markdown draft with one section per program narrative question: Canopulse-written starting text citing recorded evidence and declared facts, the evidence and facts themselves, and the unresolved items from the requirements matrix. | Prepared against the demonstration program record only, so it demonstrates the structure and states nothing about eligibility. Final review, representations and submission remain with the applicant. |
| Requirements matrix | Demonstration | A workbook of program requirements, official references, evidence needed, evidence recorded on the project version, one of four statuses and a next action, generated once per project version. | Mapped against the demonstration program record only, so no row is a statement about eligibility for a real program. No readiness percentage is produced. |
| Maps inside project documents | Planned | Locator and context maps with legend, scale, dates, scope and source notes embedded in the decision brief and application draft. | Not built inside project documents. The tract, place and batch reports carry maps today, and the project GeoJSON layer opens in any GIS tool. |
| Budget and scenario workbook | Limited coverage | Declared quantities, unit costs and sources by category, contingency and match arithmetic checks, scenario multipliers and a checks sheet, generated once per project version. | Declared inputs only. A cap or match rule applies only when a program record encodes one, and no cost, feasibility or outcome is estimated. |
Grant Evidence
| Function | Status | What it does today | Limit to know |
|---|---|---|---|
| Structured screening-evidence package | Available and tested | Organises current California UCRI records into a source-linked evidence package with an Evidence Strength Summary. | Organises screening evidence only. It does not determine eligibility, encode any official program's rules, or submit anything. |
| Official program requirement mapping | Demonstration | A program record structure with requirements, official references, attachments, budget rules and narrative questions, mapped to a project version's recorded evidence. | One demonstration record ships and no real program is encoded. A real record needs current official documents, a named checker and a date, and UCRI never substitutes for an official designation. |
CanoProof
| Function | Status | What it does today | Limit to know |
|---|---|---|---|
| Screen an area | Available and tested | Tests a geography against a declared climate-priority threshold with challenges, a robustness region, reversal search and a signed package. | Operates on frozen release values. It does not observe current conditions. |
| Compare candidates | Available and tested | Ranks two to five areas under a shared policy and reports how stable the order is under weight sampling and component exclusion. | Stability is reported over the declared weight space only. A different objective can produce a different order. |
| Verify evidence | Available and tested | Mechanically evaluates registered structured claims against source, dependency, vintage and model-scope rules. | Checks structure and scope. It cannot establish that a claim is true in the field. |
| Build a portfolio | Available and tested | Exhaustively enumerates candidate subsets under declared budget and constraint rules and reports selected projects, ties and binding constraints. | Optimises declared costs and screening objectives only. Site feasibility and causal benefits need separate evidence. |
| Check requirements | Demonstration | Evaluates a labelled demonstration rule library and your own metric rules against an area's frozen values. | The rule library is a demonstration structure, not a real program encoding. Every output is labelled as such. |
| Compare designs | Limited coverage | Cost arithmetic per scenario from declared or demonstration planning ranges, with budget fit and binding constraints. | Arithmetic only. No cooling, canopy or health outcome is predicted, and demonstration ranges are labelled when used. |
| Review outcomes | Planned | Would report what field evidence supports once completed projects are enrolled with measured outcomes. | No project is enrolled. The function returns an insufficient-evidence certificate that names what enrollment requires. |
| Assess transfer | Planned | Would assess whether outcome evidence from completed projects transfers to a new area. | No outcome data exists to transfer. The function returns an insufficient-evidence certificate and makes no estimate. |
| Certificate verification | Available and tested | Verifies a signed CanoProof package online or with the standalone offline verifier. | A valid signature establishes the integrity and origin of a package within its declared scope. It does not certify real-world truth. |
Live context
| Function | Status | What it does today | Limit to know |
|---|---|---|---|
| Live California context | Limited coverage | Current NWS station observations and AirNow reporting-area values shown beside the frozen screening baseline. | Station and reporting-area readings, not tract-wide measurements. Feeds show unavailable or stale states when upstream data is missing, and frozen scores never change with the weather. |
Workspaces and projects
| Function | Status | What it does today | Limit to know |
|---|---|---|---|
| Evaluation workspace | Available and tested | A free self-service organisation with structured review, validation and pilot operations, and a full evidence package with its verification record. | Every file carries the evaluation notice. Published quotas apply and are shown before use. |
| Saved Areas and Area Sets | Available and tested | Cross-device saved geographies and candidate sets with immutable versions, read-only sharing and certificate linkage. | Versions are captured by database triggers and cannot be edited by any API role. |
| Versioned project records | Limited coverage | A project names the organisation, purpose, optional funding program, one California study area and the release it was screened against. Every material edit creates an immutable version. | New in this release. The decision brief attaches to a version; declared scenarios and package allowances do not yet. |
| Public evidence registry | Limited coverage | Publishes completed engagement records with their verification hashes. | Only organisations a Canopulse operator has verified may publish. Evaluation workspaces cannot. |
Method, sources and validation
| Function | Status | What it does today | Limit to know |
|---|---|---|---|
| Source registry and method documentation | Available and tested | Every input product, vintage, weight and formula behind the release, downloadable as CSV, JSON and PDF. | Documents the composite baseline. Layers carry different vintages and the release is not a single-year snapshot. |
| Internal release and package QA gates | Available and tested | Enumerated checks that run during release generation and before every package ships. | Internal checks. Independent methodology review and field-outcome validation are separate and open. |
| Independent methodology and outcome review | Planned | Commissioned external review of the method and field validation of outcomes. | Not commissioned. No organisation has completed a validation study, pilot or institutional review of Canopulse. |
| Technical archive | Available and tested | Superseded releases kept unchanged so earlier outputs stay reproducible. | Archived releases are not used by any current workflow. |
Commercial access
| Function | Status | What it does today | Limit to know |
|---|---|---|---|
| Free public and evaluation access | Available and tested | The Explorer, reports, grant evidence packages, CanoProof and evaluation workspaces are free. | Pre-commercial. Nothing is sold, invoiced or guaranteed, and evaluation output is labelled. |
| Project Brief package | Planned | Up to 10 tracts, one decision brief, two declared scenarios, the existing exports and two revisions within 14 days on the same geography and release. | Not for sale. The published figure is a test price for feedback, and the decision brief it depends on is not built. |
| Funding Pack package | Planned | Up to 50 tracts, one supported program and round, an editable application draft, requirements matrix, budget workbook, maps and five revisions within 30 days. | Not for sale. Depends on the program mapping, application draft and workbooks, all of which are planned. |
| Repeat-use subscriptions | Planned | Monthly plans for saved client projects, seats, branding and version history once repeated use supports them. | No tier is advertised and no price is published until the underlying package workflow exists and has been used repeatedly. |
| Expert review | Planned | A named qualified reviewer with a defined scope, deliverable, turnaround and disclosed price. | Not offered. No reviewer is engaged and no human review is available during evaluation. |
| Self-serve checkout and package allowances | Planned | Payment or entitlement check, once-only generation reservation, verified output and authorised downloads. | Disabled. The commercial gate returns false and every paid route falls back to the request flow. |
Each status is recorded with the code and checked in the release gate before deployment. A function moves to available only when an automated check covers it; a planned function stays planned until it exists, whatever the calendar says.
Where Canopulse fits
How Canopulse works alongside existing tools.
Established tools each cover part of the picture. Canopulse brings the physical and equity signals into one screening workflow, then turns the result into deliverables.
Field comparison · capability matrix
| Capability | Canopulse | Tree Equity Score | i-Tree | CalEnviroScreen |
|---|---|---|---|---|
| Tract-level screening score | ||||
| Combines canopy, heat, and equity | ||||
| Print-ready screening reports | ||||
| Source-grounded transparency | ||||
| Batch multi-tract analysis | ||||
| Model-version audit trail | ||||
| Structured grant-evidence packages |
Canopulse does not replace Tree Equity Score, i-Tree, or CalEnviroScreen. It moves you faster from public data to a traceable, exportable screening report. Capability comparison reflects each tool’s public product; see their sites for full feature sets.
Transparent by design, not a black box.
Source-grounded
Every value traces to a named source product and vintage.
Confidence-labeled
Scores show how strong the evidence is, never false precision.
Reproducible
The formula is publicly documented and the method is open to review.
Canopulse does not replace Tree Equity Score, i-Tree, CalEnviroScreen, or urban-forestry consultants. It helps you move faster from public data to a traceable, exportable screening report.
Who it is for
Cities and counties
Consultants
Nonprofits and community groups
Grant writers
Researchers
Urban-forestry teams
Five components, one index
Every score traces to official public data
Each block in the city is a tract. Pick a layer to morph the skyline, hover to read a block, click to send a pulse through the county.
Tract city · live
Tree canopy deficit
Validation and integrity
Trust is a product feature, not a footnote.
Canopulse separates completed internal checks from ongoing validation work so planners can understand both the strength and the limits of the screening output.
Integrity center
Audit status
Completed checks
- Published UCRI formula and fixed weights
- Current California release integrity checks
- Formula reproduction against the released California UCRI components
- Source registry with dataset vintage notes
- Confidence labels for scored and provisional records
- Batch validation that keeps invalid inputs visible
In progress
- Independent review
- Outcome comparison against independently maintained datasets
- CalEnviroScreen 5.0 source join and missing-record disclosure
- Longer multi-year heat and canopy robustness testing
UCRI is a screening index. It helps identify where closer review may be useful. Confirm current source data, field conditions, program requirements, and community context before making a project decision.
Why Canopulse exists
A map shows you where it is hot. It does not show you how the number was reached.
Most climate dashboards show one layer at a time. The harder part is turning canopy, heat, and equity data into a tract-level screening result a planner, grant writer, or council office can trace back to its sources and inspect line by line. Canopulse is built for that gap.
9,033
California tracts fully scored
6
published data layers
5
weighted model components